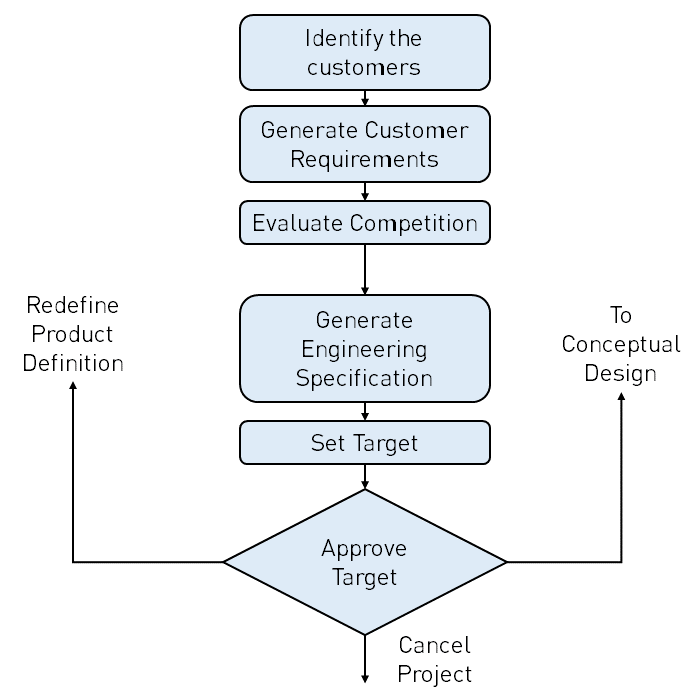
STEPS EMPLOYED FOR PERFORMING QFD
The product often is used by a different set of customers. Each set will have its own requirements. Thus, it becomes important to identify all of them. For example, Gym equipment, has two customers the purchaser who owns the gym and the consumers who are actually employing the equipment for a workout. The purchaser may want the equipment of a specific size, etc. whereas the consumer will think about the ease of operation.
The best way to ensure that all the customers are identified, is to consider the entire life-cycle of the product i.e. the people who are going to employ the product into their workflow throughout its lifecycle. Identifying and categorizing them is an important step to methodically relate them to their respective requirements.
- Observing
Making an observation and inference log of the customers using the existing product. The missing components/features can be included in upcoming designs.
- Survey
This tool is used to gather specific data based on the customers opinions. The subject of the surveys should be well defined, otherwise, the resulting data would be misleading. This tool can be implemented in using current technology i.e. telephones, emails and video conferencing. This tool is suited to an in-use product or on a product that is to be redesigned. Thus, the input would be helpful.
- Focus Groups
The focus group method uses a carefully chosen group of potential customers. The size of this group ranges between 7-10. The design team members conduct a structured discussion on a new or an existing product. This method taps into the customers imagination to set up a data-set of requirements. The main objective of this method is also to have an idea of what does not exists (that the consumer wants) in a product. This discussion is usually electronically recorded for future references.
The observing and survey methods rely on close-ended questions and the focus group method relies on open-ended questions. This step ends with the design team members analyzing data, with a motive of removing the unnecessary and redundant data.
The data from the previous step, i.e. the requirement of the customer, is utilized here. In this step, a weighing factor is assigned to the customer requirements based on the survey. This gives the designers an idea of what is relatively more important to the customers. In many cases, a product has more than one customer in such a case the weighing factor aids this comparison.
The more preferable method of extracting the weighing factor is giving the potential customer 100 points to distribute amongst the requirement (fixed-sum method). This will ensure that the more important requirements are assigned higher points. Whereas, in the case of the common 10-point system, the average weighing factor given by the customer is 8,9 or 10. We all, in our lives, have filled out surveys, don’t we do this? The reason for this is the customer feels all their requirements are equally important and this method has no room for focus on the relative importance.
This step is also called Competition benchmarking. This step takes into consideration, the opinion of the customer on how the competition approaches the customers requirements. This step has two objectives
- Knowing the market and competitive product.
- Searching the Opportunities for improving on the existing product.
In this method, the products from competitors are rated on a scale of 1 to 5 for each of the customers requirements. This method employs subjective comparison and not an objective one.
The translation of the voice of the customer to the voice of an engineer is performed in this step. Objective is to convert the requirements into all possible measurable engineering parameters and select the most relevant parameter.
A point to remember here is that if no such parameter for the requirement is found by the designers, then the conclusion can be drawn that the team has not fully understood the requirement. Also, if the engineering parameter is not measurable (in real-world units), the requirement of the customer must be readdressed.
Let’s Take the example of a car door, Customers requirement” easy to open”
- Engineering parameters possible are
- Force
- Distance of travel of the door handle
- The amount of tactile feedback if a motorized door is implemented
The most relevant parameter is the force applied by the user.
This step relates each engineering specification to each requirement. This is efficiently performed in the House of Quality diagram. This step is performed to ensure that each of the requirements has at least one strong relationship with an engineering specification. If not, the previous step is iterated.
Each engineering specification should have multiple relations with different customer requirements. This ensures that one specification can measure multiple requirements. However, each relation may not be a strong relationship.
This step has three objectives
- Determining the importance of the engineering specifications based on the relationships between requirements and specifications (step 6) and the relative importance of requirements (step 3)
- Measuring how well the competitors perform based on the ratings from step 4.
- Setting of the targets before the beginning of the design. These targets are set considering the trade-off each designer makes and how that affects the customer's demands.
This step analyses the dependency of the engineering specifications with each other. Ideally, the chosen specifications are independent of each other, but in practice this rarely happens. These dependencies are of two types, Direct Dependency i.e. when one parameter increases, the other also will increase and Indirect Dependency i.e. when one parameter increases, the other will decrease. Both types can be equally damaging or equally supporting, depending on the customers' requirements.
HOUSE OF QUALITY DIAGRAM
Each step for the QFD is converted into a visual infographic known as the House of Quality. Each part of the diagram has a specific method of data generation and entry, this is out of the scope of this article. But a fundamental understanding can be definitely imparted.
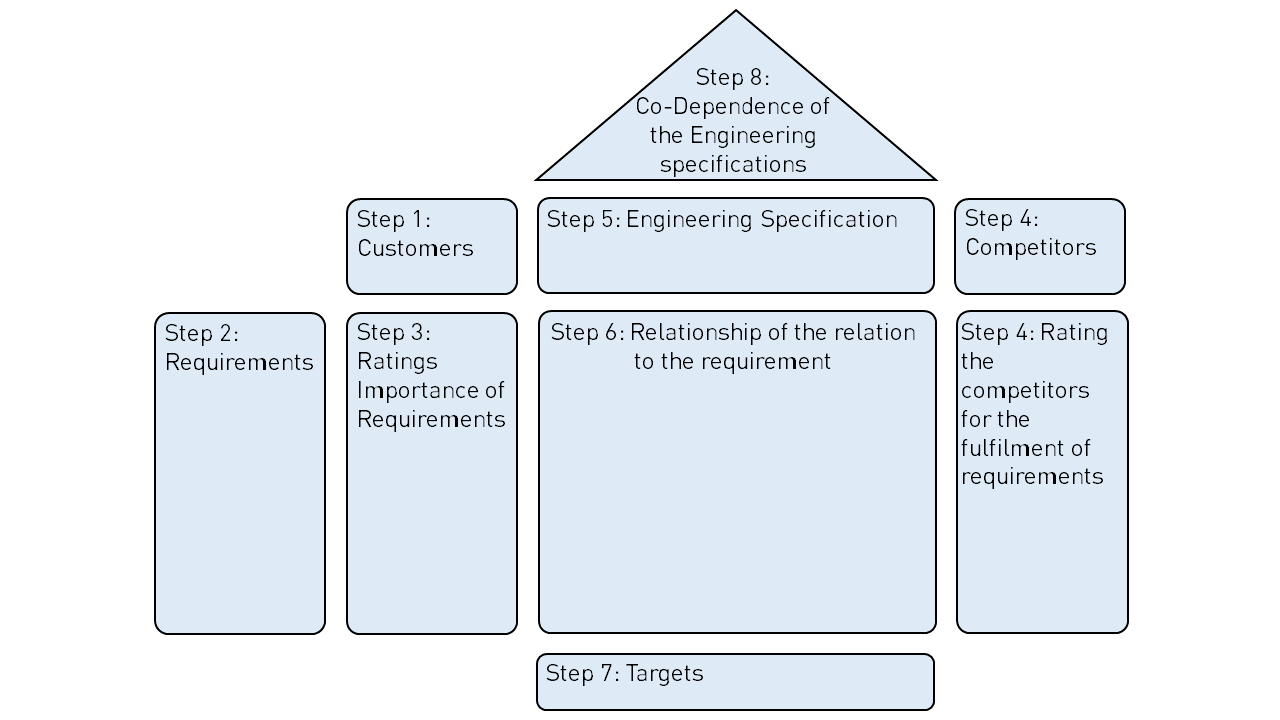
Figure 2: Illustration of sections for the QFD diagram (House of Quality Diagram)
Each step of the QFD generates data for its respective part in the house of quality diagram, as depicted in Figure 2. The identification of the customers and their respective requirements are the preliminary information entered. Then the importance rating from the customers in put into the box marked step-3. The step-4 box is the evaluation of the competitors, by a rating system, on a scale of 1 to 5, as depicted in Figure 3. The design team analyses the requirements and make decisions on the engineering specification.
A matrix is constructed in sixth step, to indicate the relationship of engineering specifications to the customers' requirement. This is also called the inter- relationship matrix. There are 4 basic categories
- Strong Relationship- (9)
- Medium Relationship- (3)
- Weak Relationship- (1)
- No relationship- (0)- indicated as a blank box.
The step-7 box is the conglomeration of all the data into targets. Each company has its own method of evaluating this section. The co-dependency relation of each engineering specification with each other is graded in the triangle marked” step-8”, as depicted in Figure 2. This is called the “co-dependency matrix”, as depicted in Figure 3.
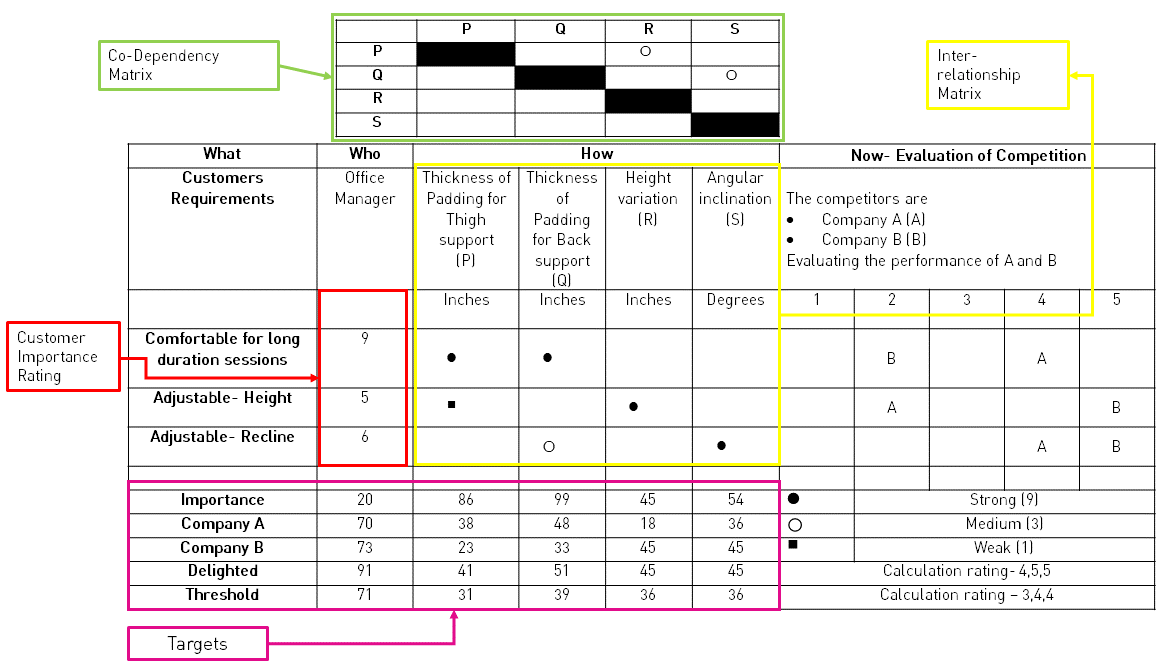
Figure 3: Example of House of quality implemented on a simple office chair.
The QFD analysis provides the designer with the following insights:
- Indication of most essential requirement for the customer is obtained, so that no compromises are made in fulfilment of that requirement. More time can be invested in innovative ideas in that area.
- Numerical targets are the outcome of this analysis, these will help in tracking the progress of the design team.
- The ratings of the competitors help the design team understand the shortcomings of the competitor and the areas to focus to give their company the edge when entering the market.
ADVANTAGES
- Ensures that the problem is well understood.
- It is useful for design as well as redesign problems.
- It forces in-depth thinking about the problem, this results in the development of good solutions
- The understanding phase of every design process requires some form of documentation, this is inherently performed by QFD.
- The changes to the specification follow a process of careful consideration to be included in the QFD. In the absence of a QFD, the specification of the product can be changed at the whim of the manger without consultation of the design team.
LIMITATIONS
- Quality function Deployment requires the right organizational structure for this method to give optimum results.
- The QFD method makes the work-flow less adaptable to changing customers demands. The QFD method becomes more costly and complex when the demands of the customers are changing. In such cases, the employment of QFD becomes damaging to the work.
- Relying too heavily on the QFD method can be damaging in terms of valuable time, cost and growth objectives. Thus, the organized employment of QFD is imperative.
- The QFD method through the various steps intends to generate accurate data. These use methods of polls and focus groups. These activities must be carefully designed, as any fault will be reflected in the data generated and they will eventually lead to misunderstood production specifications.
IMPROVIANS TAKE
The intention is to perform Quality Function Deployment for producing customer-centric products and solutions. This method when implemented using the right organizational skill produces the astonishing results in terms of customer satisfaction as well as good performance in the market. QFD can be useful in product development, but this method should be limited to the ones that are complex in form and in functionality. This ensures that as the design progresses, a need for taking a step back to redesign does not arise. The cost of delay of a product delivered into the market is higher than the part not completely satisfying the customer, keeping this in mind, for less complex products QFD must not be implemented as it consumes essential time.


